
Posted May 27th, 2015 in Water Resource Economics
When municipalities consider how to set water rates, they often look to neighboring communities as reference points. This can involve a lot of digging for data, which takes lots of time, and in the end, may be comparing apples with oranges.
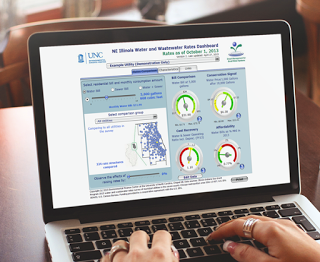
In the Chicago area, communities can now benchmark their water rates much more easily and can set comparisons to other communities that make sense. Northeast Illinois is now one of eleven locations that has a free water rates dashboard providing utilities with the ability to compare their residential water and wastewater rates against multiple characteristics, including utility finances, system size, customer demographics, and geography.

The Northeast Illinois Water and Wastewater Rates Dashboard was created by the University of North Carolina Environmental Science Center with support from the EPA Smart Management for Small Water Systems—a nationwide project of the Environmental Finance Center Network (EFCN).
The water rates data that brings this tool to life was compiled by Margaret Schneemann, IISG water resource economist and Jennifer Egert, IISG summer intern, in a survey of 224 municipalities in the greater Chicago region’s seven counties—Cook, DuPage, Kane, Kendall, Lake, McHenry, and Will.
Managing water supplies sustainably starts with getting the price right.
One of the larger goals of the water rate dashboard is for municipal utilities to make informed choices when setting water rates so that critical rate-setting factors get their proper due. “Rate comparisons taken out of context can lead to peer pressure to keep rates low while neglecting other objectives such as cost recovery and conservation,” explained Schneemann.
Complementing the dashboard is the Full-Cost Water Pricing Guidebook, which offers local decision makers basic “how tos” on implementing rates that encourage efficient water use and support investment in aging infrastructure.

The water rate dashboards include dials showing comparative measures of average monthly bills, affordability, how well rates cover operation and maintenance costs, and the level of conservation that is encouraged.
“The dashboard promotes resource sustainability while also supporting financial security for the utility and economic development for the community,” added David Tucker, EFCN project director.
For utilities that make the decision to raise water rates to more sustainable levels, the dashboard provides data to back up these proposals. In designing this resource, it was made user-friendly for a variety of possible audiences, including city officials, reporters, and customers.